
Analytics & Revenue Attribution Guide
Track, measure, and analyze the total revenue generated across all Cartwheel pillars with real-time conversion reporting and customer session logs.
Analytics Overview Dashboard
Navigate to Cartwheel Admin → Analytics (/app/analytics) for high-level store performance insights and granular event tracking:
Date Range Selectors
Switch between preset historical reporting periods using the top navigation buttons:
- 7 days (
?range=7) - 30 days (
?range=30) - 90 days (
?range=90)
Key Performance Metric Cards
The Analytics dashboard calculates 5 core business metrics scoped to your selected date range:
| Metric Card | Description & Calculation | Sub-Note Breakdown |
|---|---|---|
| Recovered Cart Value | Total dollar value of abandoned checkouts and carts recovered by Cartwheel links. | Displays total count of recovered carts (e.g. 14 recovered carts). Handles multi-currency stores automatically. |
| Emails Sent | Total sequence emails dispatched across all cart recovery, retention, and review workflows. | Displays Open Rate %, Unique-Send Click Rate %, and total failed email count. |
| Tracked Abandonment | Total sum of incomplete sessions identified on your storefront. | Breakdown showing Tracked Carts vs. Browse Sessions. |
| Offer Acceptance Rate | Overall percentage of post-purchase, checkout, and bundle offers accepted by shoppers. | Displays total count of Accepts out of total recorded Impressions. |
| Partial Recovery Rate | Conversion efficiency for targeted customer recovery segments. | Displays total conversions out of filtered email sends. |
Detailed Session & Event Record Lists
Below the primary KPI cards, Cartwheel provides three dedicated, interactive session tables:
1. Abandoned Carts Table
- Customer Email: Masked/identified customer email address.
- Cart Value & Items: Subtotal dollar value and list of products in the abandoned cart.
- Status Badge: Current status (e.g.,
OPEN,RECOVERED). - Last Active: Timestamp of customer's last storefront interaction.
- Recovery Link: Direct test link to reopen and restore the customer's cart session.
2. Browse Sessions Table
- Customer Email & Profile: Identified shopper who viewed products without adding to cart.
- Product Title & Thumbnail: Item viewed during the browse session.
- Status: Current retargeting status.
- Last Active: Timestamp of product view.
3. Exit Intent Events Table
- Visitor / Customer Key: Unique visitor reference.
- Offer Title & Funnel: Associated exit-intent discount popup.
- Event Type: Real-time event stage:
IMPRESSION: Popup was triggered and shown to the visitor.CLAIMED: Shopper clicked Apply Discount.DISMISSED: Shopper clicked No Thanks or closed the modal.CONVERTED: Shopper completed a purchase with the claimed coupon code.
- Cart Value & Timestamp: Checkout value at the time of exit interaction.
Home Dashboard Overview (/app)
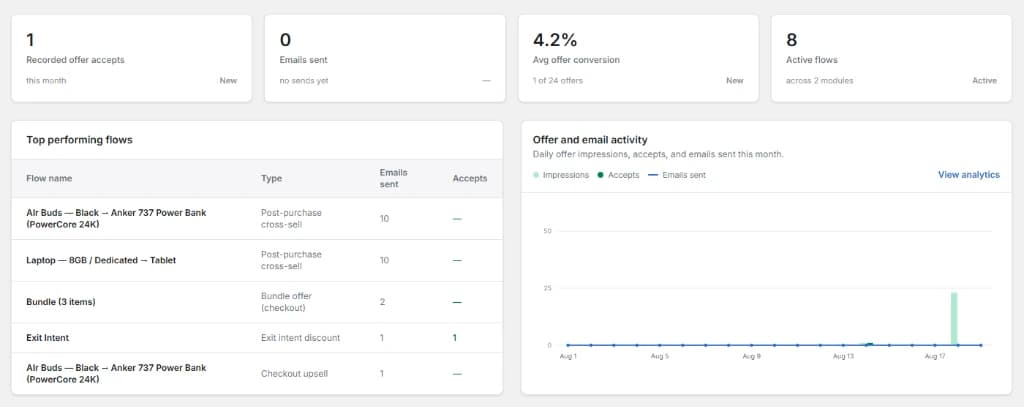
In addition to the deep Analytics page, Cartwheel's Home Dashboard (/app) provides at-a-glance operational insights:
- Monthly Metric Tiles: Real-time revenue, recovery count, and email stats with month-over-month percentage change badges.
- Top Performing Flows: Table ranking your highest-converting sequences and offers by emails sent and revenue generated.
- Recent Activity Feed: Real-time audit log of customer email sends, offer accepts, and submitted product reviews.
- Quick Setup Cards: Interactive onboarding checklist guiding you through core pillar setup.
Related Guides
- Smart Personalization Guide — AI recommendation metrics and customer segmentation
- A/B Split Testing Guide — comparing offer variant conversion rates
- Abandoned Cart Recovery Guide — optimizing recovery email performance
- Exit Intent Popups Guide — tracking modal impressions and claimed discounts